We require observability to diagnose problems, fix bugs, evaluate, benchmark, and improve our serverless applications. We need to find a way of tracking the performance of an individual transaction across the system with several distributed elements that create a serverless application. This process becomes more challenging when the architecture is event driven and there are too many parallel invocations, given that the compute offered by Lambda is ephemeral. Event logging, metrics, and tracing are all examples of observability.
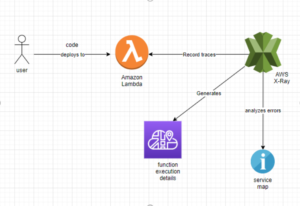
By default, each Lambda function execution sends data to Cloud Watch logs. But these logs give only request ID and operating timings, which is not complete metadata. To get more information about our function executions and time latency, we could use AWS X-Ray, an AWS service for drilling down into the execution mechanism.
A vital element of the AWS serverless architecture, AWS X-Ray enables developers to analyze performance and troubleshoot distributed microservice-based applications by constructing an excellent service graph visualization called a Service Map. It contains links between components, a dependency tree, and information on the architecture of an application. It helps to identify the issues in the application and provides request data like latency, HTTP response status, and the number of failures, making root cause analysis easier. It also enables complete end-to-end visibility of the currently running project. Above all this, X-Ray can track requests made to apps across several AWS accounts, AWS Regions, and Availability Zones.
The workflow used by AWS X-Ray is simple and proceeds as follows:
Gather traces: X-ray gathers data from all the AWS services used in an application. Then, HTTP header is added to requests that do not already have one and passed to extra tiers of request handlers to provide an end-to-end trace.
Record Traces: From the start of our application workflow until the end, AWS X-Ray compiles all collected data into traces.
View Service Map: X-Ray uses the trace data to produce a map of the services used by the application. This map visually depicts the relationships between the application's services and compiled data for each service.
Analyzing Issues: Once all traces are gathered and organized into a Service map, developers can dig deep into the service to see precisely where and what issues are occurring.
AWS X-Ray Concepts:
Segments- A segment provides us with the resource's name, request details, and details on work done. Example- when an HTTP request reaches our application, it can record data like: Host, Request, Response, Issues that occur.
Subsegments- A segment can break down the data about the work done into subsegments which will provide us with more granular details like timing information and downstream calls made by the application to fulfill the request.
Traces- Trace ID tracks the path of a request and also collects all the segments generated by a single request.
Sampling- To ensure efficient tracing and to provide a representative sample of the requests that our application serves, the X-Ray SDK applies a sampling algorithm to determine the requests getting traced.
Filter expressions- It shows health and performance information that helps us identify issues and opportunities for optimization. For advanced tracing, we can use filter expressions to find traces related to specific paths or users.
Groups- Using a filter expression, we can define the criteria by which traces are accepted into the group. We can either call the group by name or by Amazon Resource Name (ARN) to generate its own service graph, trace summaries, and Amazon CloudWatch metrics.
Annotations and metadata- Annotations are basic key-value pairs that are indexed for use with filter expressions. We can use annotations to record data that we want to use to group traces in the console. Metadata are key-value pairs with values of any type, including objects and lists, but that are not indexed. We can use metadata to record the data that we want to store in the trace, but don't need to use for searching traces.
Errors, faults, and exceptions- Error – Client errors (400 series errors) ,Fault – Server faults (500 series errors) ,Throttle – Throttling errors (429 Too Many Requests)
Hands-on:
In this hands-on, we will use AWS X-Ray to trace the execution of a Lambda function.
- Sign in to AWS console.
- Build a Lambda function that AWS X-Ray will monitor.
- Enable active tracing for the lambda function.
- Create a test event for the Lambda function.
- Test the Lambda function utilizing created event.
- Go to the AWS X-Ray console and wait for the service to calculate a traced map for a few minutes.
- For further information, look at the traces.
Below is the implementation process.
Configuration:
It's easy to enable X-Ray for Lambda by simply enabling active tracing in the AWS dashboard. But, if cloud-formation is used to deploy the Lambda, we need to add the parameter as follows:

We must additionally provide the necessary rights to Lambda in its IAM policy to enable it to send X-Ray segments:
![]()
These two adjustments must ensure Lambda is activated and delivers X-ray segments with data. To record other requests, we must install the xray-sdk library and make a few changes to the function code.
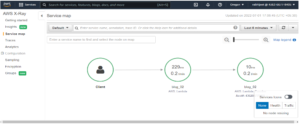
After these two steps, we can deploy our code into the lambda function and start testing it. AWS X-Ray will now trace the actions and generate a compute map. We will be able to see the trace map on the AWS X-Ray Console Dashboard.
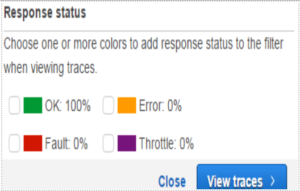
The trace list displays the outcomes of the executions. We can click on the trace ID to look for further information regarding the Lambda function. Also, we will be able to see the response in the JSON format by clicking on the Raw data tab in the X-Ray console.
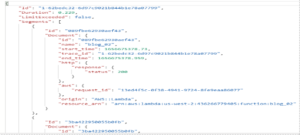
Below dashboard displays every detail of the Lambda function's execution. As per the image, we have a few warning flags in the status column that show more information when clicked.
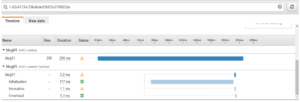
So, this is how AWS X-Ray tracks and generates minute details for every action we do on Lambda functions.
X-Ray Pricing on AWS:
With AWS, X-Ray offers a free tier as usual. Every month, the first 100,000 recorded traces are free. Above which, traces retrieved or scanned will cost $0.50 for every 1,000,000 transactions, whereas traces recorded cost $5 for every 1,000,000 transactions.
AWS X-Ray Features:
1. End-to-End tracing - AWS X-Ray provides an end-to-end, cross-service view of requests made to the application. It will give us an application-centric observation of requests flowing by gathering the aggregated data from individual services into a single unit called a trace. We can use this trace to track a single request's path as it moves through each service or tier in the application and to identify the exact location of the problems.
2. Service map - AWS X-Ray creates a map of services used by application with trace data that we can use to drill into specific services or issues. It will provide us with an observation of links between our application’s services and their respective aggregated data, including average delays and rates of unresponsive.
3. Server and Client-side latency detection - AWS X-Ray lets us visually detect node and edge latency distribution directly from the service map. We can quickly isolate outliers, graph patterns, and trends, drill into traces, and filter by built-in keys and custom annotations to better understand performance issues impacting our application and end users.
4. Data annotation and filtering - AWS X-Ray lets us add annotations to data emitted from specific components or services in our application. We can use this to append business-specific metadata that helps us better diagnose issues. We can Observe and filter the data for traces with the help of parameters like the value of annotation, average value of delays, the response status of HTTP, and the timestamp.
5. Console and programmatic access - We can use AWS X-Ray with the AWS Management Console, AWS CLI, and AWS SDKs. The X-Ray API gives us the ability to access the services programmatically, so that we can easily export trace data into our own analytical dashboards which are built by custom method.
6. Security-AWS X-Ray is integrated with AWS Identity and Access Management (IAM) so that we can control which users and resources have permissions to access our traces and how.
Conclusion
We observe that we can monitor, trace and troubleshoot the Lambda functions with AWS X-Ray without keeping track of executions and analyzing the Lambda manually.

