Popular Tech Company Cut Processing Time and Data Processing Costs by 50% with Delta Lake

Customer Details:

Client Name: Under NDA

Industry: Technology Company

Development Country: Arizona

Solution: Incremental Processing

Used Services: Delta Laka, Data Bricks


The renowned technology company embraces Delta Lake solutions, revolutionizing their data processes, reducing time and cost inefficiencies, and achieving remarkable data flexibility and features.


Overview: 


The web hosting industry giant, catering to a vast clientele of 21 million customers worldwide, confronted a significant challenge in efficiently processing its ever-expanding data. With an extensive array of services, including domain names, website hosting, email marketing, and professional solutions, the company accumulated a massive amount of data.


To tackle the data processing bottleneck and optimize data management, the web hosting company joined forces with VirtueTech. This strategic collaboration aims to streamline data processing times while simplifying data storage, space, and maintenance. By leveraging VirtueTech’s expertise, the company seeks to enhance its data infrastructure and continue providing seamless services to its millions of customers globally.

The Challenge of Web Hosting Company:

Here are the challenges that web hosting company was facing:


Parameters  Challenges 
Scale of Operations As the world’s largest domain registrar with 21 million users, the company faces significant challenges in handling vast amounts of financial transactions and data on a daily basis.
Time-Consuming Data Updates Incorporating new data into the dataset and updating it daily results in extensive processing times, causing complete downtime for end-users during the update process.
Risk of Data Problems Processing the complete dataset daily poses a high risk of data loss, incomplete updates, failures, delays, and glitches, impairing the ability of business analysts and end-users to identify and leverage critical business opportunities.
Impact on Efficiency and Productivity The extended downtime during data updates hinders the end-users’ productivity and efficiency, leading to potential business losses and user dissatisfaction.
Need for a Scalable Solution The domain hosting organization must adopt a scalable solution that allows seamless integration of new data without affecting the availability of existing data, ensuring continuous operations and timely insights for business analysts and end-users alike.


As the world’s largest domain registrar company with 21 million users, the web hosting company was facing challenges in processing its everyday’s data. As a domain hosting organization, the company was incorporating financial transactions and data everyday. The data was then gathered and processed in one dataset which was used by business analysts for project status, resolving any issues and tracking progress.


The mud here was that when new data comes in every day, the complete dataset needs to be updated, which takes a lot of time to process and update. Moreover, during the data update in the dataset, the old data was unavailable for the end user to use. The end-user was facing complete downtime during the update process, which resulted in a loss of efficiency and productivity.

Additionally, processing the complete dataset daily carries a high risk of data problems such as loss, incomplete data updates, failures, delays, and glitches. Such high risk impairs the company’s end users and business analysts’ ability to promptly identify business opportunities and other business developments.

The Agile Solution for Web Hosting Company 

Here’s how VirtueTech Inc. provides solutions that help web hosting company with the following advantages and solutions for their challenges.


Parameters  Solution 
Delta Lake VirtueTech Inc. introduces Delta Lake to the web hosting company, enabling flexibility and automation within the dataset, leading to enhanced efficiency without downtime.
Flexible and Available Dataset Delta Lake ensures that existing data remains accessible while updating new data, allowing end-users to utilize the dataset without interruption.
Time and Resource Savings Unlike traditional methods, incremental processing focuses only on new or changed data, reducing processing time by up to 50% and optimizing resource utilization.
Mitigating Data Risks By avoiding daily processing of the entire dataset, incremental processing minimizes the chances of data glitches and loss, resulting in cost savings and improved data integrity.
Limitless Storage and Data Analysis Incremental processing eliminates duplicate data preservation, unlocking storage and maintenance opportunities. It also captures and records daily data changes, enabling detailed analysis of past data and identifying specific changes over time.


VirtueTech Inc. helped web hosting company with asset properties of Delta Lake that provide Flexibility and automaticity across the dataset. This approach of Delta Lake drives Flexibility, availability, and automaticity within the dataset, allowing the end users to enhance their efficiency without any downtime.

Moreover, Delta Lake makes life easier for business analysts as it brings more Flexibility to the dataset by updating data without hindering the old existing data. That means Delta Lake only processes and updates the new data that comes into the dataset daily, and the rest of the data stays as it is, which is available for the end user even during the update.

Traditionally, data processing involves processing the entire dataset, which can take hours and require a lot of resources. However, with incremental processing, only the new or changed data is processed, which can be done in a few minutes. This can save up to 50% of the processing time and make the data available for use much faster.

Moreover, incremental processing reduces the risk of data glitches and loss as organizations do not need to process entire datasets daily. Such advantages reduce the overall data processing cost by 50% and expenses that occurred during data failures and glitches.

Additionally, there are a few more advantages of incremental processing at web hosting company. The process unlocked limitless storage, space, and maintenance opportunities by reducing duplicate data preservation.

Moreover, it also captures and snaps everyday data changes in the dataset that help GoDaddy analyze past data. The capture of transactions aids organizations in going back in time to see how the data looked a few days ago and helps them mark and identify the changes that came and what data exactly looked like.

The Consequences of Solutions Developed From Delta Lake. 


The web hosting company implemented the Delta Lake solution in January 2023 in only a few of their datasets, which delivered a 50% cost reduction in data processing and a 50% time reduction. They have more than 100 datasets in which Virtue Tech Inc. will implement Delta Lake capabilities, resulting in significant cost and time reductions for the technology company in the future.

Overall Benefits of Delta Lake:

  • Cost reduction on data processing operations by up to 50%.
  • Reduction in data processing time of up to 50%.
  • Unlock limitless opportunities for storage, space, and maintenance.
  • Increase business analyst efficiency.
  • Improved data availability capacity by up to 10 times.


How To Build A Chrome Extension

Building an extension over chrome browser adds a lot of flexibility and functionality to any website. We can make use of a browser engine to do additional stuff which is not possible using simple html and javascript.

In this blog we will develop a chrome extension named Tab++. This extension will help in searching any text on the opened chrome browser tabs. For example, if we have 20 tabs opened on the chrome browser, any text can be searched using this extension on each of the tabs.By clicking on a result, it will open the tab with yellow highlight. In the long side, this extension can also be used in positioning and managing all open tabs. The Source code of this extension is mentioned in the last section of this blog, for you to manually download and try on your PC.

Our first step is to define a manifest file. Manifest file holds all extension metadata like name, description and certain permissions from the browser to use the extension. Here is the content of manifest.json file:

{

“manifest_version”: 2,

“name”: “Tab++”,

“version”: “1.1”,

“icons”: {

“128”: “logo.png”

},

“permissions”: [

“tabs”,

“storage”,

“http://*/*”,

“https://*/*”

],

“minimum_chrome_version”: “23”,

“description”: “Arrange the tabs in chrome easily”,

“content_security_policy”: “script-src ‘self’ https://ssl.google-analytics.com; object-src ‘self'”,

“short_name”: “Tabs Search & Navigator”,

“update_url”: “https://clients2.google.com/service/update2/crx”,

“background”: {

“scripts”: [“jquery-3.2.1.min.js”,”script.js”]

},

“web_accessible_resources”: [

“close.png”

],

“browser_action”: {

“default_icon”: “logo.png”,

“default_popup”: “popup.html”

},

“commands”: {

“_execute_browser_action”: {

“suggested_key”: {

“default”: “Alt+O”,

“mac”: “Command+O”

},

“description”: “Activate Tab++”

},

“ordertitle”: {

“suggested_key”: {

“default”: “Alt+T”

},

“description”: “Order By Title”

},

“orderurl”: {

“suggested_key”: {

“default”: “Alt+U”

},

“description”: “Order By URL”

}

},

“content_scripts”: [{

“js”: [“jquery-3.2.1.min.js”,”jquery.mark.min.js”,”content.js”],

“all_frames” : false,

“css”: [],

“matches”:    [“<all_urls>”],

“run_at”: “document_end”

}]

}

A couple of background script files have been added on the manifest. One is a normal Jquery file downloaded to our folder and the other one is our own script. Background scripts are directly injected to the browser. They are more powerful than the normal script files injected into the page. Using them we can call browser’s own API to do things which browser only can do.

There are also a couple of scripts in the content script part of the manifest. Content script is just like normal javascript file that will be embedded on any webpage opened on the browser. Through this we can manipulate with DOM objects just like normal javascript. Additionally, we can also communicate with background script in both directions using content script.

There is one more html file called popup.html in the manifest, which is just like a HTML file that opens a small pop up when you click on the extension icon. In that pop up we can place various html elements like textbox, checkbox etc.

Here is how our background script looks like:

var from=””;

var to=””;

var url=””;

var country=””;

var multiply=”1″;

var conv=0.0;

var alltabs;

var myport=null;

var chk1=false;

var chk2=false;

var chk3=false;

var term=””;

var mybookmarks;

var tabmove=false;

chrome.extension.onConnect.addListener(function(port) {

port.onMessage.addListener(function(msg) {

if(msg==”GetTabs”)

{

myport=port;

chrome.storage.local.get(‘tabplusplus’, function (result) {

var str = result.tabplusplus;

if(str==undefined)

{

getTabs();

return;

}

var res = str.split(“##mysplit##”);

var chkk1 = res[0];

var chkk2=res[1];

var chkk3=res[2];

chk1=JSON.parse(chkk1);

chk2=JSON.parse(chkk2);

getTabs();

});

}

if(msg.indexOf(“search=”)!=-1)

{

msg=msg.replace(“search=”,””);

term=msg;

}

if(msg.indexOf(“closetab”)!=-1)

{

msg=msg.replace(“closetab”,””);

chrome.tabs.remove(parseInt(msg), function() { });

}

if(msg.indexOf(“updatetabs”)!=-1)

{

msg=msg.replace(“updatetabs”,””);

var arr=msg.split(“,”);

var newtabs=[];

var v1 = ‘tabplusplus’;

var obj= {};

obj[v1] = “false##mysplit##false##mysplit##false”;

chrome.storage.local.set(obj);

tabmove=true;

for(var i=0;i<arr.length-1;i++)

{

chrome.tabs.move(parseInt(arr[i]), {index: i});

for(var j=0;j<alltabs.length;j++)

{

if(arr[i]==alltabs[j].id)

{

newtabs.push(alltabs[j]);

break;

}

}

}

setTimeout(function(){

tabmove=false;

}, 200);

alltabs=newtabs;

//myport.postMessage(alltabs);

}

if(msg==”ordertitle”)

{

getTabs();

setTimeout(function(){

alltabs.sort(sortOn(“title”));

tabmove=true;

for(var i=0;i<alltabs.length;i++)

{

chrome.tabs.move(alltabs[i].id, {index: i});

}

setTimeout(function(){

tabmove=false;

}, 200);

myport.postMessage(alltabs);

}, 100);

}

if(msg==”orderurl”)

{

getTabs();

setTimeout(function(){

alltabs.sort(sortOn(“url”));

tabmove=true;

for(var i=0;i<alltabs.length;i++)

{

chrome.tabs.move(alltabs[i].id, {index: i});

}

setTimeout(function(){

tabmove=false;

}, 200);

myport.postMessage(alltabs);

}, 100);

}

if(msg.indexOf(“changetab”)!=-1)

{

msg=msg.replace(“changetab”,””);

chrome.tabs.update(parseInt(msg), {active: true});

if(term!=””)

{

chrome.tabs.query({

windowId: chrome.windows.WINDOW_ID_CURRENT

}, function (tabs) {

chrome.tabs.sendMessage(parseInt(msg), {

“functiontoInvoke”: “highlight”,

“val”:term

});

});

}

}

});

});

function getTabs()

{

alltabs=[];

//alert(JSON.stringify(mybookmarks));

chrome.tabs.query({

windowId: chrome.windows.WINDOW_ID_CURRENT

}, function (tabs) {

for(var i=0;i<tabs.length;i++)

{

var tab = new Object();

tab.id=tabs[i].id;

tab.img=tabs[i].favIconUrl;

tab.url=tabs[i].url;

tab.title=tabs[i].title;

tab.data=””;

chrome.tabs.sendMessage(tabs[i].id, {

“functiontoInvoke”: “getcontent”,

“index”:i,

});

alltabs.push(tab);

}

setTimeout(function(){ senddata(); }, 100);

});

}

function sortOn(property){

return function(a, b){

if(a[property].toLowerCase() < b[property].toLowerCase()){

return -1;

}else if(a[property].toLowerCase() > b[property].toLowerCase()){

return 1;

}else{

return 0;

}

}

}

function senddata()

{

if(chk1)

{

alltabs.sort(sortOn(“url”));

}

if(chk2)

{

alltabs.sort(sortOn(“title”));

}

chrome.tabs.query({

active: true,

currentWindow: true

}, function(tabs) {

var tab = tabs[0];

var id = tab.id;

myport.postMessage(“activetab=”+id);

myport.postMessage(alltabs);

});

}

chrome.runtime.onMessage.addListener(function(msg, sender, sendResponse) {

if(msg.text == “takecontent”)

{

var tabid=sender.tab.id;

var data=msg.val;

var index=msg.index;

alltabs[index].data=data.toLowerCase();

}

});

updateTabCount();

function updateTabCount()

{

chrome.tabs.query({

windowId: chrome.windows.WINDOW_ID_CURRENT

}, function (tabs) {

chrome.browserAction.setBadgeText({text: ”+tabs.length});

});

}

chrome.tabs.onMoved.addListener(function() {

if(!tabmove)

{

getTabs();

var v1 = ‘tabplusplus’;

var obj= {};

obj[v1] = “false##mysplit##false##mysplit##false”;

chrome.storage.local.set(obj);

}

});

chrome.tabs.onRemoved.addListener(function(tabid, removed) {

updateTabCount();

//getTabs();

});

chrome.tabs.onCreated.addListener(function() {

updateTabCount();

//getTabs();

});

chrome.windows.onFocusChanged.addListener(function(windowId) {

updateTabCount();

//getTabs();

});

getTabs();

chrome.commands.onCommand.addListener( function(command) {

if(command === “ordertitle”)

{

getTabs();

setTimeout(function(){

tabmove=true;

alltabs.sort(sortOn(“title”));

for(var i=0;i<alltabs.length;i++)

{

chrome.tabs.move(alltabs[i].id, {index: i});

}

var v1 = ‘tabplusplus’;

var obj= {};

obj[v1] = “false##mysplit##true##mysplit##false”;

chrome.storage.local.set(obj);

setTimeout(function(){

tabmove=false;

}, 200);

myport.postMessage(alltabs);


}, 100);

}

if(command === “orderurl”)

{

getTabs();

setTimeout(function(){

tabmove=true;

alltabs.sort(sortOn(“url”));

for(var i=0;i<alltabs.length;i++)

{

chrome.tabs.move(alltabs[i].id, {index: i});

}

var v1 = ‘tabplusplus’;

var obj= {};

obj[v1] = “true##mysplit##false##mysplit##false”;

chrome.storage.local.set(obj);

setTimeout(function(){

tabmove=false;

}, 200);

myport.postMessage(alltabs);


}, 100);

}

});

Here is how our content script looks like:

chrome.extension.onMessage.addListener(function (message, sender, callback) {

if (message.functiontoInvoke == “getcontent”) {

var data=””;

if(document)

{

if(document.getElementsByTagName(‘body’)[0])

{

data=document.getElementsByTagName(‘body’)[0].innerText;

}

}

chrome.runtime.sendMessage({text: “takecontent”,val:data,index:message.index}, function(response) {

});

}

if (message.functiontoInvoke == “highlight”) {

var term=message.val;

hightlight(term);

}

});

var currentIndex = 0;

var $results;

var offsetTop = 50;

function hightlight(term)

{

$(“body”).unmark();

$(“body”).mark(term, {

separateWordSearch: false,

done: function() {

$results = $(“body”).find(“mark”);

currentIndex = 0;

jumpTo();

}

});

}

function jumpTo() {

if ($results.length) {

var position,

$current = $results.eq(currentIndex);

if ($current.length) {

position = $current.offset().top – offsetTop;

window.scrollTo(0, position);

}

}

}

Here is the GITHUB link of the complete project:

https://github.com/sarathisahoovt/tab-

Steps to install any chrome extension from your local PC:

1 – Download the source code to any folder on your PC.

2 – Go to chrome://extensions/ on browser

3 – Click Developer mode checkbox

4 – Click load unpacked extension button

5 – Give the path of the source code folder

6 – That’s it. Your extension is ready. Enable it by clicking on the puzzle icon on right top panel of your browser.


Blockchain & NFT

Blockchain may sound a little bit scientific or like rocket science, but in reality, it is nothing but just advanced web technology. So before jumping directly to the block chain, let’s find out how it came and what is the history of web technologies.

So basically there are 3 generations of web technologies till now since the internet came into human’s life.

  1. Web 1.0 — Web 1.0 is the very first generation of web technology where the owner of a website owns all content. So right now there are many web 1.0 websites that are static where users can’t do anything but only see the content or images on those websites or download them and print them. They can’t interact with the website. Ex — All kinds of company official websites like our own VT website come under this technology.
  2. Web 2.0 — This is the 2nd generation web technology where users not only read the content, but also can add their own content to the website. Ex — Facebook, Twitter, YouTube, IMDB and many more where users can post content, hit a like button or retweet something. So right now most of the websites come under web 2.0
  3. Web 3.0 — This is the latest web technology and a little bit complex as compared to other twos. Here the content of any website or technology is not owned by any organization. Rather, those are replicated among several computers. There is not a single owner, but we all audience, whoever have a computer, can be the equal owner. So here the term decentralized web technology comes to the birth and we can refer to it as block chain.

So what is blockchain. If we divide it into 2 words, It will be block + chain. So blocks means many computers and chain means the internet which is binding all computers in a single network. Think about any popular website like Google or Facebook. All the content present on their sites are owned by Facebook or Google. Imagine  a situation, let’s say someone hacked Facebook, then they can get all of your data and can manipulate it or delete it. Or let’s say Facebook will ban your account, then they can delete your data. So actually you do not own your own content, but the company Facebook is owning your content and they can do anything with your data and even they are doing this like selling your data to third parties or showing personalized ads etc. So to solve this problem, Decentralized or block chain technology came. So your data can’t be owned by any 3rd party company. Your data will be copied to thousands or millions of computers on that network. Even if you have a computer, you can also part of that network and store data. All you have to do is, just install their software in your computer and that’s all. If you are part of their network, you can also be called as a miner. Even you can earn lots of money just helping them to be part of their network as a miner. What is the role of a miner and how can you earn money? I will explain this later in today’s presentation. So imagine a blockchain having millions of computers or miners, any hacker may hack 1 or 2 or 10 computers, But it is not possible to hack millions of computers. Also for any reason all millions of computer users can’t ban your account. So this is the main advantage of blockchain. Though blockchain got popular after 2020, there were few software ways back in 2000 which were based on the same technology. One example is BitTorrent. So I don’t know how many of you know about BitTorrent, But I have been a big fan of BitTorrent since my childhood. It is a software where users can share movies, games, etc without hosting them in a single server. So you can download games from other online user computers simultaneously. So it was super fast to share files as in the old days the internet was costly as well as so slow.

So based on this concept digital money or you can say crypto currency was born. So the world’s 1st crypto currency bitcoin started this revolution. How bitcoin works, let’s understand this from another example. Let’s say you are a customer of ICICI bank. So, all your money resides in an ICICI account. Let’s say someone hacked your account, he literally can take all your money. Or under some circumstances, ICICI bank goes bankrupt, Then also you will lose all your money. So you don’t have any option rather than trusting your bank. So what bitcoin is doing is that it has a blockchain of millions of computers. Let’s say Sarathi has 1000 bitcoin. So that information is stored across all million computers of the bitcoin blockchain. Let’s say a hacker hacked 1 computer and tried to steal all my bitcoins, But the software is able to detect all other millions of computers and found only 1 computer says Sarathi has 0 bitcoin but the rest are saying Sarathi has 1000 bitcoin. So it automatically rectifies it and again changes that hacked computer data to Sarathi has 1000 bitcoin. So until and unless a hacker will hack more than 50% of computers of that blockchain, he can’t steal my bitcoin and which is really impossible for a hacker to hack half million of computers across the world. That’s why crypto has been always safe. That’s the reason people started storing their money in digital or crypto forms instead of any bank. That’s why within a short period of time, bitcoin values grew exponentially.

Do you want to imagine how much it grew?? In 2010 1 bitcoin value was only 0.04 rupees and in 2021 it reached at it’s all time high to around 50 lakh rupees per bitcoin. So imagine if you would have invested only 100 RS on bitcoin in 2010, Then now it would become 125 Crores of rupees. So 100 RS to 125Crores in just over 11 years. So how are your feelings now? Feeling guilty that why didn’t you just know about crypto 10 years back? Same here, I’m also feeling that. But still, it’s not that late. There are many other crypto coins whose values are under 1 rupees and can grow to lacks in a few years. But the problem is that you need to understand and research on which coin you should invest now as there are thousands of coins in the market at present. So why bitcoin values increased. Because unlike dollars or Indian rupees, the system can’t print as much bitcoin on a regular basis. So when initially bitcoin came to market, there were total 18,962,004 number of coins and that number is same till now. Because there is no way to introduce more bitcoins due to the protocol of this blockchain. But if you consider the world population now, It is about 775 crores. So on average, there is 1 bitcoin for about 408 people or in reverse there is only 0.002 bitcoin for each individual. So you can imagine how rare bitcoin is. That’s why with the increase in demand, the values came to this point and may even grow 100X in next few years, Who knows?

Now I will jump a little bit deeper into how blockchain or bitcoin transactions works. I won’t go into much dipper technology wise as it will be more complex to understand the full architecture of the technology. So let’s start with Gas fees. Many of you must have heard about Gas fees when talking about crypto. So what is this. As from the term “Gas”, it means some fuel to run the system. Just like in the USA people call a petrol pump a Gas station. Because Gas can be anything, Diesel, Petrol, LPG or electricity. So as previously I said there are millions of miners or you can say computers are part of a single block chain. All computers need to be connected to the network all the time. Means each user in that block chain has to power on his computer all the time and for that he needs to pay the electricity and internet bill. So for every transaction the data to be updated on all computers on that blockchain network. Let’s take an example. Sarathi has 1000 bitcoins and Gangadhar has 100 bitcoins. So this data is there on all the computers. So Sarathi transferred 100 bitcoin to Gangadhar. So after the transfer Sarathi should have 900 bitcoins and Gangadhar should have 200 bitcoins. So that new data to be updated on all computers and validated by all. So some gas fees to be distributed among all the miners. So now the average cost of a bitcoin transaction is around 10$ but 80$ for Ethereum. I will come to Ethereum later. But think, For every transaction, I must distribute 10$ for miners. So in this way miners earn money. That’s why to earn more, many big agencies are also working as miners. They don’t need a computer for that. To do the processing, they only need a hard-disk and a GPU. So right now in the market,you can purchase many cheap GPUs if you want to earn money as miners. Frame starts from 8000 Rs and each GPU around 20000 Rs and a motherboard 22000 Rs.

https://www.amazon.in/XtremeMiners-Mining-Motherboard-Without-Cooling/dp/B09GW8HD9Z/ref=asc_df_B09GW8HD9Z/?tag=googleshopdes-21&linkCode=df0&hvadid=544918407505&hvpos=&hvnetw=g&hvrand=13288971398292538945&hvpone=&hvptwo=&hvqmt=&hvdev=c&hvdvcmdl=&hvlocint=&hvlocphy=1007799&hvtargid=pla-1471871964947&psc=1

Here you can see a set of 8 mining GPUs you only have to pay 8K+160K+22K. So just for 2lacks RS investment you can be an 8 blocks miner which is way less than buying 8 super graphics computers. You don’t need to do anything. Just connect that GPUs to the internet and power it on. That’s all. And with the software provided by blockchain you can see how much you earn each day. So as you can see this is a very profitable business, so many more new miners are joining the blockchain everyday. That’s why the gas fees were increasing with the time. So a few years back Ethereum gas fees were only 1 dollar, but now it is 80$. Because more miners means more electricity and so the cost of gas. But more miners means more security and more decentralization.

Now let’s talk about Etherium. So after the success of bitcoin, Ethereum came into existence. Ethereum fundamental was, Why only digital coin, why not decentralize the whole software system. So it is able to run some sort of code across all the computers. I won’t go deep into Ethirium technology, Because even 2 hours won’t be enough just to touch its basis and I have only 30 minutes. Anyway, just think, Ethereum is a framework which allows us to create our own crypto in a few hours. So after the release of Ethirum thousands of new crypto built as It was giving the framework to create a new crypto currency. Before that, to create a new coin, It would be years of work with proper blockchain expertise. But again with the popularity of Etherium, Number of miners increased and so did the gas fees also. So that is the real problem now in this industry. So for every transaction it needs on average 80$ of gas fees. Which is so high. Let’s take an example. You want to transfer 10$ of crypto to your friend. But you have to pay 80$ gas fees. So it is not feasible for small transactions. So only big transactions like millions of dollars can be done with Ethirum. But here it loses the game because people can’t make small transactions. That’s why many other blockchain came like Solana, Binance etc. They are making transactions with less gas fees because they don’t add more miners. They added only a few thousand miners to their network. But again this is against the principle of decentralization. Because less miners means less decentralized, which means less secured. So to solve the Ethereum problem Layer2 and ZKRollUp technology came.

Now let’s talk a little about Layer2 and ZKRollUp technology without going into so deep. Because again the presentation will be longer to go into details about these 2 new technologies. So Layer2 suggests that, instead of the transaction to be updated on each block or computers, It will randomly select a few of the blocks. Let’s say 100 computers and there it updates the transaction value. Ex — Sarathi has 1000 bitcoin, And if he wants to transfer 100 bitcoins to Gangadhar, Then, instead of updating all millions of blocks on Layer1, It just randomly picks only 100 computers and updates the transaction value there. So here the gas fee is very less. It is around 0.20 $ only. So at the end of a certain period, let’s say one day, It will just ZKRollUp all the transactions. Let’s say 1000 transactions total happened on Layer2 on day1, So it combines all 1000 transactions and updates on Layer1 at one shot. So 80$ Layer1 gas fees will be divided into 1000. So 0.08$ will be the only transaction cost to update from Layer2 to Layer1. So for the end user total gas fees will be 0.20+0.08 = 0.28$ only instead of 80$ . That’s why this new technology is a game changer for Ethereum. Right now one of the best coins that supports this Technology is Loopring. So you can say loopring is the future for Ethereum scale up. Apart from that Loopring has many more other advantages which would be a separate discussion altogether . I advise everyone to do their own research before investing in any crypto.

Now where to buy crypto in India. There are many CEX (Centralised Exchanges) like coindcx, coin switch kuber, wazirx in India. You can create a free account and start buying crypto starting with only 100 Rs. But again your crypto is not safe there because the exchange keeps the private keys of your wallet with them and never gives it to you. So by chance if anyone hacked those exchanges, you may lose your coins. That’s why it is better to create a wallet on any decentralized wallet like meta mask or loopring where you will get your private key and all your crypto are safe. So again loopring is the coin which is giving a framework to build decentralized exchanges, that’s another reason I have invested in it. But unfortunately loopring or metamask is not working in India till now, So we have to depend on a centralized exchange.

Now let’s discuss NFT. NFT stands for non-fungible token. So what is non-fungible? Let’s take an example. So in this whole world, out of 775 crores only 1 Sarathi is there which is me. Let’s say I go to an interview and I may demand 10$/hour as a salary. Imagine a situation, God cloned Sarathi and made 2 Sarathi in this world. So 2nd Sarathi will go to the same interview and ask for 5$/hour. Again I counter the offer for 2$/hour. See how my demand decreased only because of another Sarathi. Think about 5 Sarathi or 100 Sarathi, Then I can’t even get work anywhere. My value is there if and only if there is 1 Sarathi in the whole world. That’s why I’m a non-fungible commodity. Nobody can replace me. Same way, each individual is a NFT in this world. Because there is no 2nd on this earth of the exact same type. That’s why world’s famous Monalisa’s painting costs around 780 million dollars on today’s date. But if we copy it, It won’t cost more than a paper. Such a way, if you buy any limited edition car (limited edition means that model will be manufactured only in few numbers), It’s price will be way higher than normal edition of the same brand. Now we are living in a digital world. So in the digital world, it is very easy to copy any photo or video. That’s why in the blockchain world, there will be only 1 image of each type and there will be only a single owner of any picture. That’s what is called NFT in the blockchain world. Since it is a single copy in the entire blockchain, that’s why the price is so high. So you can upload any of your art on blockchain and list it as NFT. You can earn huge money by selling it at a higher price to another person. So again to upload a NFT on blockchain, the gas fees is high because NFT needs to be copied to all computers in the block chain. That’s why Layer 2 solution  like loopring comes handy,which reduces the gas fees to minimal. That’s why with the evolution of Layer2, more and more artists are now interested in creating NFT on blockchain. The NFT price depends on how unique it is. Even Twitter’s Ex-CEO Jack Dorsey sold his first tweet as NFT at a price of 2.9 million dollars. Because the 1st tweet means one of his kind and the 2nd tweet can never be a first tweet. That’s why the value is so high. Also NFT will play a major role in metaverse projects. Again, Metaverse will be a separate discussion altogether. Fun fact is Facebook recently changed its name to Meta.

Anyway this is just an overview of how NFT works on the block chain. If you want to create your own NFT, the most popular marketplace is OpenSea. Go to their website and you can create NFT by paying the Gas fees. If you want to pay less gas fees, then you have to wait for a little longer until Layer 2 like loopring will partner with any other marketplace to support Layer2 NFT.

Improve Observability Using AWS X-Ray

We require observability to diagnose problems, fix bugs, evaluate, benchmark, and improve our serverless applications. We need to find a way of tracking the performance of an individual transaction across the system with several distributed elements that create a serverless application. This process becomes more challenging when the architecture is event driven and there are too many parallel invocations, given that the compute offered by Lambda is ephemeral.  Event logging, metrics, and tracing are all examples of observability.  

By default, each Lambda function execution sends data to Cloud Watch logs. But these logs give only request ID and operating timings, which is not complete metadata. To get more information about our function executions and time latency, we could use AWS X-Ray, an AWS service for drilling down into the execution mechanism. 

A vital element of the AWS serverless architecture, AWS X-Ray enables developers to analyze performance and troubleshoot distributed microservice-based applications by constructing an excellent service graph visualization called a Service Map. It contains links between components, a dependency tree, and information on the architecture of an application. It helps to identify the issues in the application and provides request data like latency, HTTP response status, and the number of failures, making root cause analysis easier. It also enables complete end-to-end visibility of the currently running project. Above all this, X-Ray can track requests made to apps across several AWS accounts, AWS Regions, and Availability Zones.  

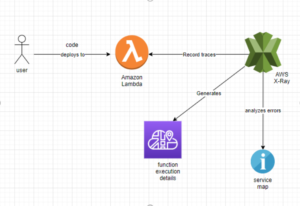
The workflow used by AWS X-Ray is simple and proceeds as follows: 

Gather traces: X-ray gathers data from all the AWS services used in an application. Then, HTTP header is added to requests that do not already have one and passed to extra tiers of request handlers to provide an end-to-end trace. 

Record Traces: From the start of our application workflow until the end, AWS X-Ray compiles all collected data into traces. 

View Service Map: X-Ray uses the trace data to produce a map of the services used by the application. This map visually depicts the relationships between the application’s services and compiled data for each service.  

Analyzing Issues: Once all traces are gathered and organized into a Service map, developers can dig deep into the service to see precisely where and what issues are occurring. 

AWS X-Ray Concepts: 

Segments- A segment provides us with the resource’s name, request details, and details on work done. Example- when an HTTP request reaches our application, it can record data like: Host, Request, Response, Issues that occur.

Subsegments- A segment can break down the data about the work done into subsegments which will provide us with more granular details like timing information and downstream calls made by the application to fulfill the request. 

Traces- Trace ID tracks the path of a request and also collects all the segments generated by a single request. 

Sampling- To ensure efficient tracing and to provide a representative sample of the requests that our application serves, the X-Ray SDK applies a sampling algorithm to determine the requests getting traced. 

Filter expressions- It shows health and performance information that helps us identify issues and opportunities for optimization. For advanced tracing, we can use filter expressions to find traces related to specific paths or users.

Groups- Using a filter expression, we can define the criteria by which traces are accepted into the group. We can either call the group by name or by Amazon Resource Name (ARN) to generate its own service graph, trace summaries, and Amazon CloudWatch metrics. 

Annotations and metadata- Annotations are basic key-value pairs that are indexed for use with filter expressions. We can use annotations to record data that we want to use to group traces in the console. Metadata are key-value pairs with values of any type, including objects and lists, but that are not indexed. We can use metadata to record the data that we want to store in the trace, but don’t need to use for searching traces. 

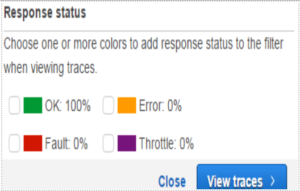
Errors, faults, and exceptions- Error – Client errors (400 series errors) ,Fault – Server faults (500 series errors) ,Throttle – Throttling errors (429 Too Many Requests)  

Hands-on: 

 In this hands-on, we will use AWS X-Ray to trace the execution of a Lambda function. 

  •  Sign in to AWS console. 
  •  Build a Lambda function that AWS X-Ray will monitor. 
  •  Enable active tracing for the lambda function. 
  •  Create a test event for the Lambda function. 
  •  Test the Lambda function utilizing created event. 
  •  Go to the AWS X-Ray console and wait for the service to calculate a traced map for a few minutes. 
  •  For further information, look at the traces. 

Below is the implementation process. 


Configuration: 

It’s easy to enable X-Ray for Lambda by simply enabling active tracing in the AWS dashboard. But, if cloud-formation is used to deploy the Lambda, we need to add the parameter as follows: 

We must additionally provide the necessary rights to Lambda in its IAM policy to enable it to send X-Ray segments: 

These two adjustments must ensure Lambda is activated and delivers X-ray segments with data. To record other requests, we must install the xray-sdk library and make a few changes to the function code. 

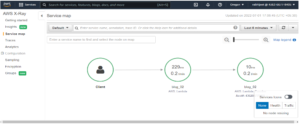
After these two steps, we can deploy our code into the lambda function and start testing it. AWS X-Ray will now trace the actions and generate a compute map. We will be able to see the trace map on the AWS X-Ray Console Dashboard. 

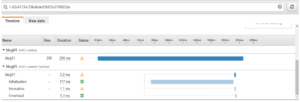
The trace list displays the outcomes of the executions. We can click on the trace ID to look for further information regarding the Lambda function. Also, we will be able to see the response in the JSON format by clicking on the Raw data tab in the X-Ray console. 

Below dashboard displays every detail of the Lambda function’s execution. As per the image, we have a few warning flags in the status column that show more information when clicked. 

So, this is how AWS X-Ray tracks and generates minute details for every action we do on Lambda functions. 

X-Ray Pricing on AWS: 

 With AWS, X-Ray offers a free tier as usual. Every month, the first 100,000 recorded traces are free. Above which, traces retrieved or scanned will cost $0.50 for every 1,000,000 transactions, whereas traces recorded cost $5 for every 1,000,000 transactions. 

AWS X-Ray Features: 

1. End-to-End tracing - AWS X-Ray provides an end-to-end, cross-service view of requests made to the application. It will give us an application-centric observation of requests flowing by gathering the aggregated data from individual services into a single unit called a trace. We can use this trace to track a single request’s path as it moves through each service or tier in the application and to identify the exact location of the problems. 

2. Service map - AWS X-Ray creates a map of services used by application with trace data that we can use to drill into specific services or issues. It will provide us with an observation of links between our application’s services and their respective aggregated data, including average delays and rates of unresponsive.

3. Server and Client-side latency detection - AWS X-Ray lets us visually detect node and edge latency distribution directly from the service map. We can quickly isolate outliers, graph patterns, and trends, drill into traces, and filter by built-in keys and custom annotations to better understand performance issues impacting our application and end users.

4. Data annotation and filtering - AWS X-Ray lets us add annotations to data emitted from specific components or services in our application. We can use this to append business-specific metadata that helps us better diagnose issues. We can Observe and filter the data for traces with the help of parameters like the value of annotation, average value of delays, the response status of HTTP, and the timestamp. 

5. Console and programmatic access - We can use AWS X-Ray with the AWS Management Console, AWS CLI, and AWS SDKs. The X-Ray API gives us the ability to access the services programmatically, so that we can easily export trace data into our own analytical dashboards which are built by custom method. 

6. Security-AWS X-Ray is integrated with AWS Identity and Access Management (IAM) so that we can control which users and resources have permissions to access our traces and how.

Conclusion 

We observe that we can monitor, trace and troubleshoot the Lambda functions with AWS X-Ray without keeping track of executions and analyzing the Lambda manually. 

Migration to AWS and Amazon Redshift from On-prem After New Acquisition

Subhead: Migrating to Redshift leapfrogged primitive data warehouse infrastructure constraints

Problem: GoDaddy acquired Registry from Neustar in 2020. Prior to the acquisition GoDaddy had an initiative to move their infrastructure to the AWS cloud. Virtue Tech was brought in during the project to migrate the Registry on-prem infrastructure to AWS. There had been several false starts and GoDaddy needed experienced data architects to ensure they would meet the stringent SLA requirement dates to complete the migration to AWS. The Virtue Tech team developed an architecture and worked with the GoDaddy management team to validate the proof the concepts. The project was divided into three phases and then delivered making sure that the final TSA deadline was met.

Registry had a lot of compliance reports from partners and registrar’s looking for information. The data is from all over the world. China, Taiwan, Australia, Europe and of course from the U.S. The raw data comes from the various source pipelines, however Neustar had a very primitive infrastructure that had been built a long time ago, and it was not in the cloud. A few people manually maintained the infrastructure. The processes, upgrades and any issues that came up were all managed reactively and manually. There were no notifications for errors or performance related issues on various jobs that run in the background to generate these reports and get the data updated.  

  • There were several false starts prior to the Virtue Tech team being brought to the project. This meant they had only a few months to design a data architecture and complete the migration to stay in compliance with the SLA migration completion date. 
  • Report data was coming from multiple countries and clients and needed to be generated per contractual agreements with customers after the migration.

Solution:

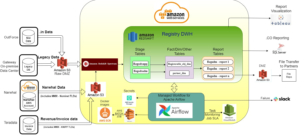
The data architecture that Virtue Tech developed for the project is depicted in the diagram below. On the left you see the data sources. Some of the source data comes from a group called Narwhal, based in Melbourne, Australia. They are also now part of . The data is kept secure with encryption/decryption logic. The solution includes encryption technology with GPG keys that are maintained and set to expire after a certain predetermined time following security best practices. The raw data is in 50 to 60 tables. The data moves through the process using the reference tables, then it’s transformed into the intermediate tables and we may add a final set of tables too. Overall, there are between 150-250 tables in use every day. 

The data scheduler is Managed Workflow for Apache Airflow (MWAA). Scheduler helps track back each task within a daily, weekly, or monthly load. AWS also provides a service to check and display the timing on a dashboard that management can view to see how things are working. The Docker maintains container logic which can be updated every couple of months. For example, you can check for any errors and team performance. Data can be made available for visualization in Tableau or other visualization tools.

Keys to success: Due to the experience and skills of the Virtue Tech team, they were able to quickly design and prove out the architecture. The team devised a three-phased approach to the project that enabled them to successfully complete the project within the final deadline.  

Results: 

  • The GoDaddy team was able to meet the overall SLA deadline for migrating to AWS cloud. 
  • Saved over $125,000 per year on labor cost of maintaining on-premise infrastructure.
  • Cut the processing time for reports by 2/3rds. 
  • Enhanced security and flexibility with AWS cloud. 
  • Added alert capability with Slack and email integration that didn’t exist prior to the migration. 
  • No capital costs for migration.

Outcome and moving forward:  The GoDaddy team was able to meet the overall SLA deadline for migrating to the AWS cloud. At a minimum, the project has saved over $125,000 per year on labor cost of maintaining the on-premise infrastructure. The performance improvements were compelling too. Reports that were taking seven hours to run are now running in under two hours. This means that the processing time for reports was cut by more than 2/3rds. GoDaddy is also benefitting from the enhanced security and flexibility they get with the AWS cloud. The data architecture designed by Virtue Tech added alert capabilities that didn’t exist prior to the migration. Errors and performance metrics are being instantly communicated due to integrations with Slack and email. Plus, there were no capital costs for migrating to AWS. Due to the success of the project, there is currently interest and plans within GoDaddy to add more data sources from Teradata, MMX, IN and others. Then there will be even more internal and external customers who want to get reports and insights from this Framework.


How To Build An API Connector

Do you want to access data from any third–party URLs for analyzing purposes? Do you want to know how often your website has been visited or how many visitors have registered on your page? A simple API call covers that all. But it would help if you had something in between your API and “the endpoint” to connect. That’s where the API Connector comes in. Before writing the code blocks for that, let’s get familiar with the term and different components of “API Connector,” shall we? 

What is AN API? 

The first question that comes to our mind before building API Connector is what is an API? In simple language, it is a block of software code that allows two applications to communicate with one another to access data. It is an infrastructure that creates the potential for applications to share data. 

What is an API Connector?

For integrating two applications, an API Connector has to be built between them. It acts as a link between two applications for data sharing and access. 

Let’s take a Mac to TV integration analogy; Assume that my Mac only has a thunderbolt mini display API and that my TV only has an HDMI API. The connector is the component that will establish a connection to the API and transmit the data as a data stream to the next message processor. The component you hold when you insert the cable into the Mac in this example is the connector. Likewise, a connector on the other end plugs into the HDMI slot in my TV. 

It looks like an API Connector is connecting our base URL to the endpoint for the data. But giving sensitive information for authorization from the client is not advisable. So, is using API Connector safe at all? 

It is. An API call’s URL is entirely safe for data handling as it is never sent to the user’s browser. None of the data that is retrieved or viewed is stored by API Connector. Only call headers and parameters marked as ‘client safe’ are sent to the user’s browser. Parameters, such as a secret API key or password, are never kept as client safe. 

Okay, so let’s start building an API Connector and check it by calling a GitHub API to check the user’s credentials. 

If the def get_data() function creates a successful API connection(status_code =200), then it dumps the data as a JSON format. Otherwise, it returns an error. 

The next part comes where we try to handle the API error for different HTTPS status codes. 


On the above, the function, as you can see, returns different messages for different HTTPS status codes. For error code 401 (I.e., the unauthorized access error), we used the HTTPBasicAuth method that takes two parameters. Username and personal access token as Password. On correct inputs, it will ask for the local file name, where it will store the data. 

But what will happen when the user provides an URL name with many invalid characters? For that, there needs a validator that checks the URL. The code works as follows: 

For example, the below screenshot gives a test case where it’s an open API call that stores data under the file name “test.json.” 

Now, for data cleaning purposes (to normalize data from raw data), the information must be stored on an s3 bucket. That step is done in three modules. First comes where we check if any bucket with the same name has been created or not. If it already exists, then we first delete the content of that bucket. Below module does that: 

After deleting the contents, the next step is to delete the bucket. 

If there is no redundant bucket, the task is to create and dump the JSON data onto it. 

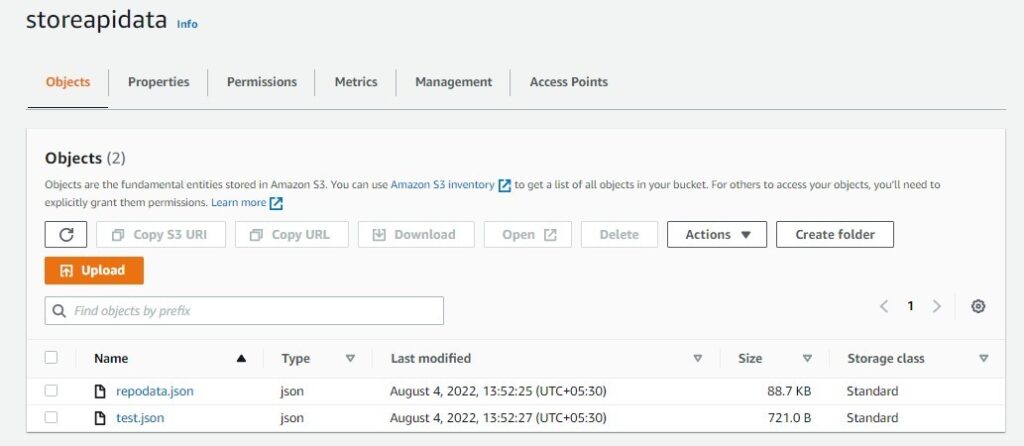
The bucket created in the AWS console looks like: 

Tada! Now, we have the required raw data that will be useful for data cleaning. 


Our journey up the ladder to become an aws advanced tier partner!

Thrilled and proud to announce that our efforts paid off and we have finally become a AWS Advanced consulting partner!! 
Virtue Tech has always perceived AWS as a strategic partner and will continue to collaborate with them to deliver next-gen Cloud, Big data & Analytics services. This partnership status not only acts a stepping stone but also paves a path to grow our AWS prowess exponentially in the field of data & analytics. It also opens our doors to many funding and customer opportunities from AWS. 

Padma Ayala, CEO: 
“When we first became an AWS Select Partner in 2018, the dream of becoming an AWS Advanced Partner seemed far-fetched. However, we have worked diligently towards our goal, and after four years, we can proudly announce our newest achievement.  We are officially an AWS Advanced Partner! “ 

It truly has been a team effort to achieve this important milestone. While our engineers were busy solving a variety of customer problems in the Data and AI realm, our marketing team has been effectively articulating those solutions to the world. Similarly, our tech leadership has supported and motivated our engineers to make certifications part of their goals. Getting 20 customer satisfaction reviews was easier due to the exceptional work our teams delivered on various projects. Additionally, the support we received from the AWS team was nothing short of incredible. Our relationship with them took us to the next level. Our new status as an AWS Advanced Partner will position us better to help provide customers with cost-effective, innovative solutions. We will also continue to solve complex technical challenges and deliver value to our customers, which is the core mission of the Virtue Tech Inc. Team 

Bhakti Joshi, Alliance & Marketing Lead: 

“Advanced partnership status is no small feat for the humble beginnings of the company. It’s the true reflection of our competence, hard work and ambitions. As a holistic endorsement of our AWS capabilities, it confirms that we have been stepping up AWS usage and implementations at our customers, bringing new AWS business, staying on top with high CSAT scores and keeping our tech team up-to-date with their skillsets.” 

 We believe in exploiting the power of cloud, data & analytics to carve our niche offerings as per the market demand. This badge has given us an opportunity to better positioned our expertise in building scalable & high value data solutions. 

Our CEO, Padma Ayala with our AWS Partner Development Manage, Morgan Matsuoka and our AWS Partner Success Manager, David Mayer on Partner Visit.

GitHub Actions 

GitHub Actions is a continuous integration and continuous deployment (CI/CD) platform that enables developers to automate their workflows across issues, pull requests, and more. GitHub Actions was introduced in 2018 to assist developers in automating their workflows within GitHub. 

All GitHub Actions automation is handled via workflows, which are YAML files placed under the .github/workflows directory in a repository that defines automated processes. 

There are different core concepts for every workflow. They are: 

  • Events: A workflow is triggered by specific triggers called events. 
  • Jobs: Jobs are a set of steps executed on the same runner. Unless otherwise stated, each run in a separate VM while running concurrently with other jobs. 
  • Steps: Steps are the individual tasks that run commands in a job. Only one runner is used to execute all steps that are present in a job. 
  • Actions: It is a command that is executed on a runner, and it is the core element of GitHub Actions. 
  • Runners: It is a GitHub Actions server that runs the workflows when they’re triggered. At a time, the runner runs only a single job. 

What are Linters? 

Linters are programs that inspect the quality of the code by displaying errors and warnings. The advantages of using Python linters are: 

  • Project bug prevention 
  • Making Python code understandable to all programmers 
  • Identifying unnecessary code fragments. 
  • Simplifying and cleaning up the code 
  • Check for syntax errors, etc. 

Pylint, Flake8, and PyFlakes are some examples of linters. 

Pylint 

Pylint is a static Python code analysis tool that identifies programming errors, invalid code constructs, and coding standards violations. Furthermore, Pylint can be adjusted to our needs by disabling some of the reported bugs; for example, output messages can only include information about specific kinds of errors. Pylint message consists of five errors: R, C, W, E, and F. 

Below are the sample workflows which run when the developer raises the pull request: 

Advantages of Pylint: 

  • It triggers more false positives present in the code. 
  • It can be customized for specific kinds of errors 
  • It gives the rating for the code quality

Factors fueling the new wave of data management

Over the last decade, data has grown in importance to become a strategic asset to businesses. Yet a lot of enterprises are still struggling to manage enormous amounts of data being generated. Given that, smart data management methods are a necessity to deliver timely and optimal outcomes.